Version 1.01.00
pistats samples and displays various operating
parameters of both the Pi3 and Pi4 series of computers.
The program can write the data to a text file, which is a spreadsheet compatible CSV file:
The dialog can be resized; including maximum screen display. The initial dialog size is larger than the minimum width/height allowed.
User can set the graph colors, background, grid, and foreground/data-line. The graphic data normally scrolls right to left. The user can reverse for left to right scrolling.
Program remembers position, width, height, and user set parameters between uses.
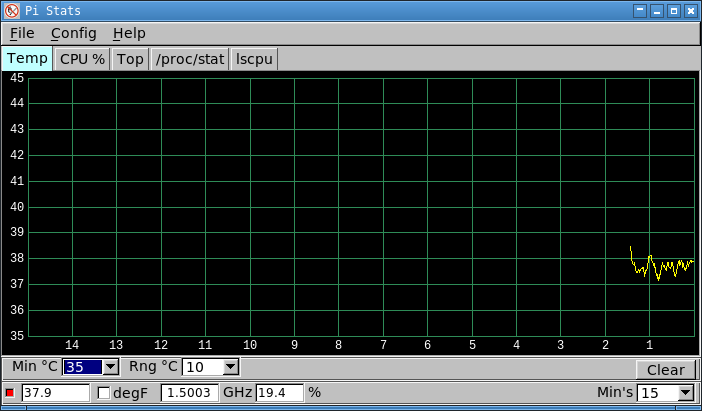
- CPU temperature at 1 second intervals.
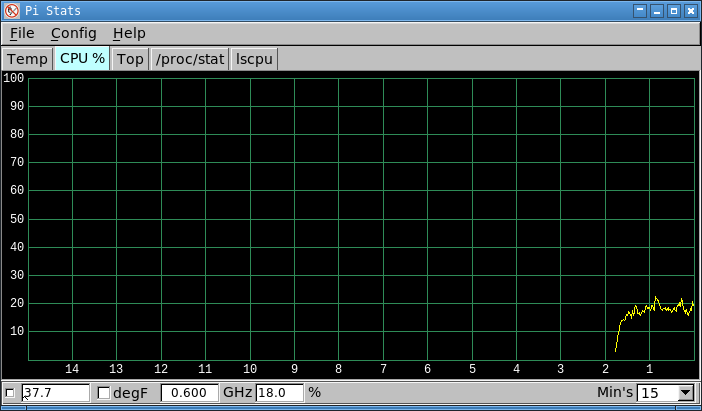
- CPU load percentage
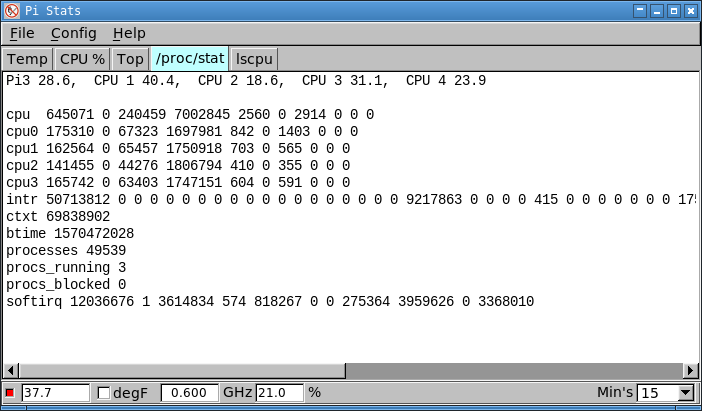
- Raw data from the /proc/stat file
- Interpreted data from the /proc/stat file
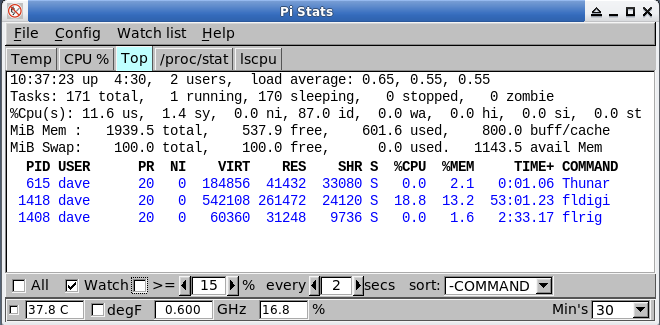
- Processed output from the program 'top' every NN seconds
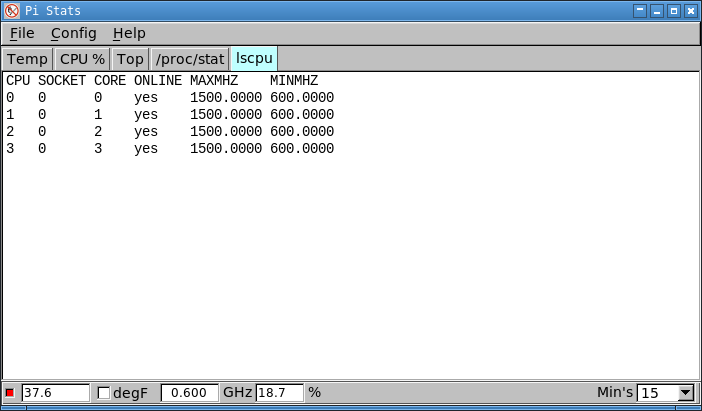
- Raw data from the lscpu command
text:
- CPU in degrees Celsius or Fahrenheit
- CPU clock frequency in GHz
- CPU load in percent
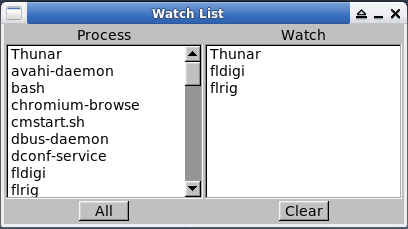
- Top output, configurable list of processes
- proc/stat contents
- lscpu output
graphic:The graphic scales can be changed without the need to reset the graph.
- CPU in degrees Celsius. The temperature scale origin and range can be set by the user. The time scale duration can be set by the user.
- CPU percentage, 0 ... 100 percent. Time scale synchronized to the CPU temperature plot
The program can write the data to a text file, which is a spreadsheet compatible CSV file:
Sec Min Temp Freq % total % core1 % core2 % core3 % core4During operation a small indicator will flash WHITE/RED in the lower left corner at a 1 second interval.
The dialog can be resized; including maximum screen display. The initial dialog size is larger than the minimum width/height allowed.
User can set the graph colors, background, grid, and foreground/data-line. The graphic data normally scrolls right to left. The user can reverse for left to right scrolling.
Program remembers position, width, height, and user set parameters between uses.