Table of Contents
Spectrum Scope Description
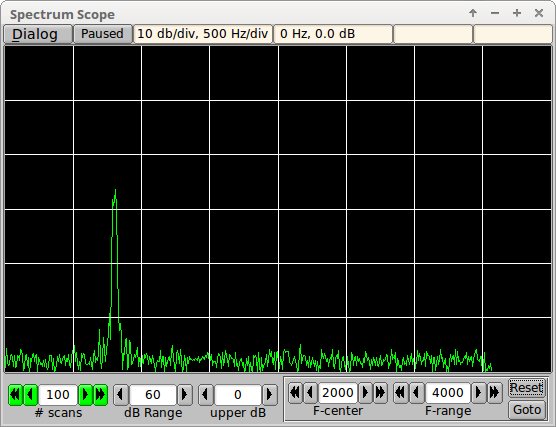
The Spectrum Scope is an analysis tool used to evaluate received signals. It can be used to measure signal integrity, audio-codec noise floor, transceiver passband characteristics, Rx signal spectrum, etc. The time domain audio stream is converted to the frequency domain using a Fast Fourier Transform, FFT. The FFT uses a snapshot of 8192 audio samples obtained from a sliding window. At any instance in time the FFT is computed from the immediate past 8192 samples. A 8192 sample set in the time domain results in a set of 4096 complex values in the frequency domain.
The fldigi modems use a sampling rate of 8000, 11025, 12000 and 16000 samples per second. The respective FFT's then can display values up to 1/2 of the sample rate. The viewed frequency range is constrained to 0 to 4000 Hertz.
The display is signal magnitude in dB versus frequency.
Operating Controls
The Spectrum Scope operating controls are used to set:

- the averaging of FFT conversions, '# scans'
- top to bottom range of dB scale, 'dB Range'
- the upper vertical scale value in dB, 'upper dB'
- the center frequency in Hertz, 'F-center'
- the frequency range in Hertz, 'F-range'
- reset frequency range to 0...4000 Hertz, 'Reset'
- go to the current waterfall tracking frequency 'Goto'
- SHIFT-left click on the spectrum display will also center the selected point in the display
When the Spectrum Dialog first opens, or when the # scans is changed that control is displayed in the gray background color. When the scan count has reached or exceeds the # scans then that control changes to green as shown above.
The scope graticule is always 10 dB per division on the vertical scale. The horizontal scale is dependent on the the selected frequency range:
- greater than 2000 Hertz - 500 Hertz per division
- between 1001 Hertz and 2000 Hertz - 200 Hertz per division
- between 501 and 1000 Hertz - 100 Hertz per division
- between 251 and 500 Hertz - 50 Hertz per division
- less than or equal to 250 Hertz - 25 Hertz per division
Signal Characteristics
Basic Signal Measurement
A measurement of amplitude and frequency is made by left clicking on the display with the center of the cross-hair cursor placed on the data point of interest. The FFT display can be paused to take a snapshot of the values.
- Right click on the display to toggle between running and paused, or
- Press the Running/Paused button to toggle betweeen running and paused.
The label will change to indicate the state of the FFT processing; "Running" or "Paused".
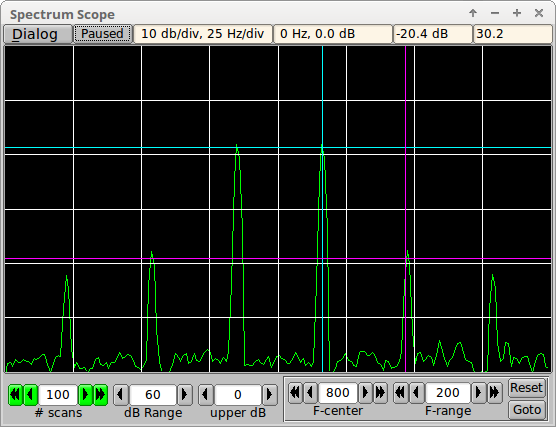
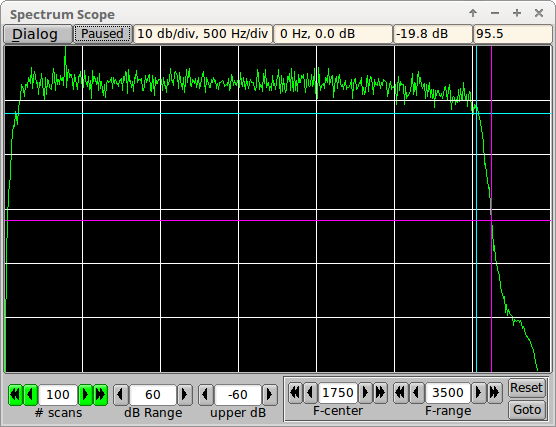
The above image shows a psk-31 idle (no modulation) test signal whose characteristics are
- S/N 40 dB
- IMD minus 20 dB
a signal that no one wants to put on the air, but is too often observed. The frequency / dB readout to the right of the "Paused" indicator was obtained by left clicking on the signal just to right of center. The 3rd order intermodulation frequency is clearly 20 dB below the fundamental phase modulation signal. A clean psk-31 should be better than minus 25 dB IMD. Modern transmitters can achieve IMD levels at or better than -30 dB when not overdriven. No ALC is the rule. Set the transmitter power level to full power and then reduce the audio drive to no more than 25% of full power. This will usually result in a PSK signal of which you can be proud.
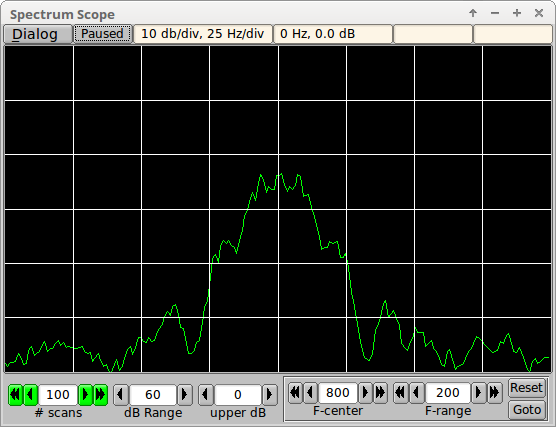
Here is the same signal during modulation:
Differential Signal Measurement
You can measure the dB difference between two points:
- '1' + left mouse click : first point (cyan line)
- '2' + left mouse click : second point (magenta line)
- '3' or 'c' + left mouse click : clear both points
The signal level and frequency differences will be shown in the right most top status control.
Entry of points 1 and 2 need not be in order and either the #1 or #2 point can be selected multiple times to extract dB differences over a range of point pairs. Selecting measurement points will be easier if you pause the FFT display.

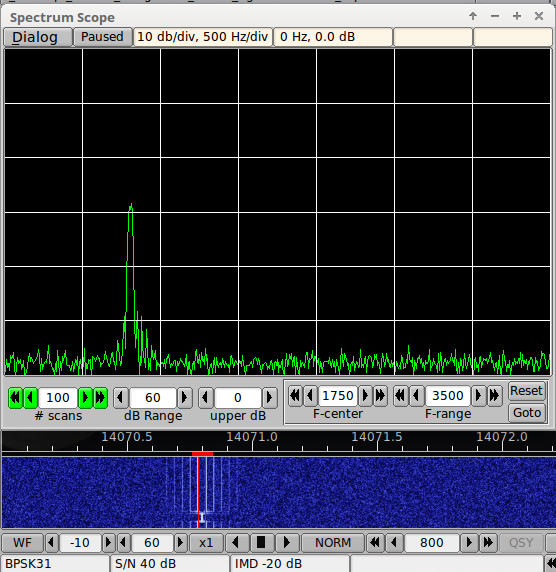
Agreement with main fldigi dialog
fldigi measures the S/N and IMD of a psk signal on it's main dialog. These measurements are made only during idle. During modulation the values are either blanked or dimmed at the user's discretion. This illustrates the test signal display both on the spectrum viewer and on the main waterfall.
Menu
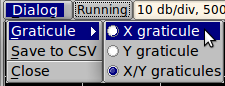
Select whether the Signal Measurement points are shown with amplitude, frequency or both as linear graticules.
You can capture the current full FFT spectrum at any time, both when running or paused. Select the "Save to CSV" menu item and a comma separated value file will be save to the fldigi temp folder.
Close the spectrum viewer by either selecting the "Close" menu item or clicking the dialog decoration "X" button.
Filter Evaluation
This illustrates using the Spectrum Scope to view and evaluate a transceiver filter. This is 40 meter noise on an IC-7200 with the filter set to 3000 Hertz.
Interaction with waterfall
The spectrum scope view and the waterfall tracking point can be coordinated in one of two ways
- Pressing the "Goto" button on the Spectrum Scope dialog
- Normal left-click selection of a waterfall signal.
In either case the waterfall tracking point will become the new center of the spectrum display and the width a multiple of the current mode bandwidth. You can configure the waterfall interaction on the Waterfall/Mouse configuration tab.
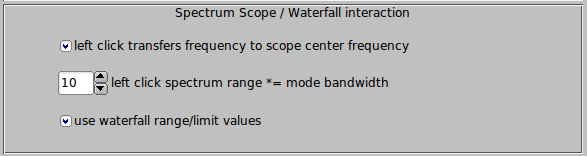
- select "left click transfers..." to enable the waterfall left-click / scope interaction.
- set the multiplier factor for the initial Spectrum Scope frequency range.
- select "use waterfall range/limit values" to set the Spectrum Scope dB Range and upper dB initial values.
CSV file usage
The comma separated value file can be opened using any spread sheet program. My personal preference is the program Gnumeric (available for Unix, Linux and Windows). The file contains columnar data for frequency and magnitude (linear). You can use the spread sheet program mathematics to generate a column of 20log10(mag) values.